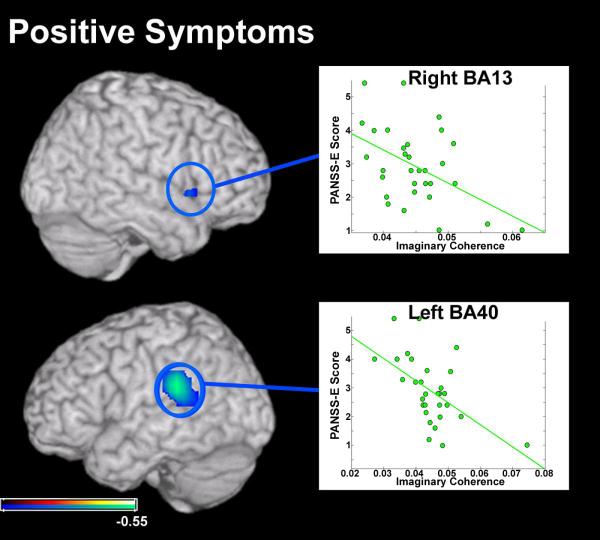
Figure 2.
Results from a pairwise correlation between global connectivity (GC) measures in the patient group with positive symptom ratings from the Positive and Negative Symptom Scale, Extended (PANSS-E). Voxels that are negatively correlated with symptom strength are circled in blue and color scaled blue to azure. Connectivity of a region in the right hemisphere in Brodmann’s Area 13 (BA13) was negatively correlated with positive symptoms assessed in these patients. We also identified a negative relationship between GC measures and positive symptoms in a region of the left inferior parietal lobe, in Brodmann’s Area 40 (BA40). Statistical maps (Pearson’s r) are thresholded (p<0.05, uncorrected) and superimposed over a rendering of the MNI template brain through MRICro.

