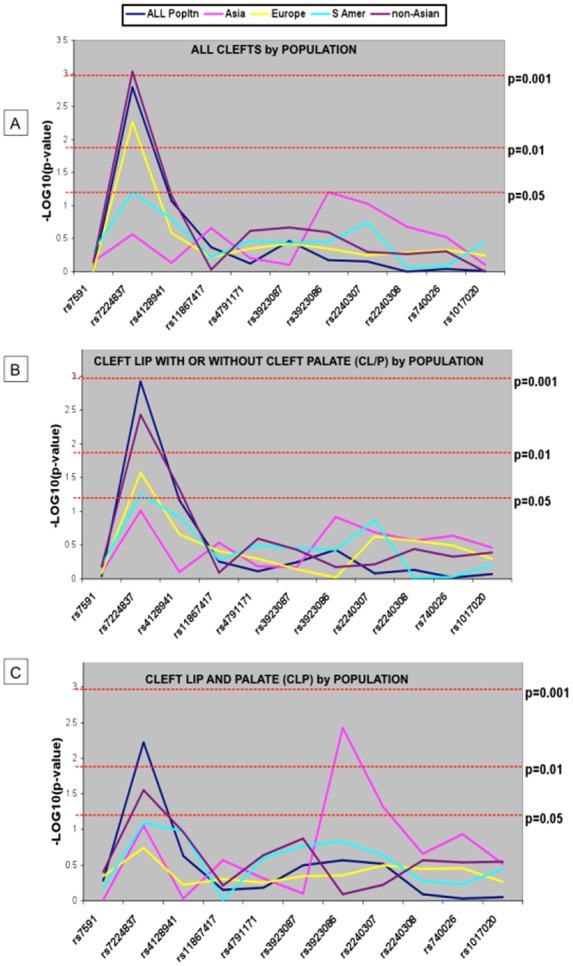
Figure 1.

Results of TDT analyses of AXIN2 SNPs and oral clefts by population groups. (A) For all clefts. [Note strongest association for SNP rs7224837 in non-Asians (p = 0.0009) and Europeans (p = 0.005) and in the combined populations (p = 0.002). The lack of association in the other population groups indicates that the association in the combined population is primarily due to contributions from non-Asians.] (B) For CL/P (cleft lip with or without cleft palate). [Note strongest association with rs7224837 in non-Asians (p = 0.004) and in the combined populations (p = 0.001).] (C) For CLP (cleft lip with cleft palate). [Note strongest association for SNP rs3923086 in Asians and rs7224837 in non-Asians (p = 0.004) and in the combined populations (p = 0.006).]
