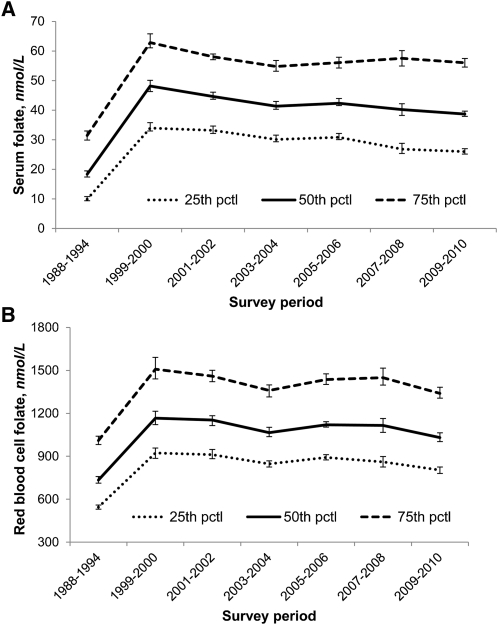
FIGURE 1.
Selected percentiles for pre- and postfortification serum (A) and RBC (B) folate concentrations by survey period (NHANES 1988–2010). Concentrations measured from 1988–1994 and from 1999–2006 by the Bio-Rad radioassay were adjusted to make them comparable to the 2007–2010 concentrations measured by microbiologic assay (13, 16, 17). Error bars represent 95% CIs. Sample sizes (n) for serum folate were as follows: 23,359 (1988–1994), 7411 (1999–2000), 8242 (2001–2002), 7692 (2003–2004), 7639 (2005–2006), 7705 (2007–2008), and 8184 (2009–2010). Sample sizes (n) for RBC folate were as follows: 22,846 (1988–1994), 7393 (1999–2000), 8220 (2001–2002), 7618 (2003–2004), 7578 (2005–2006), 7728 (2007–2008), and 8222 (2009–2010). pctl, percentile.

