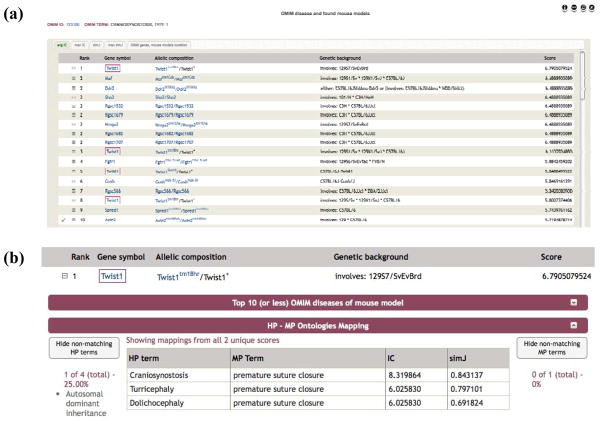
Figure 6.
OWLSim phenotype comparisons between human and mouse presented in the mouseFinder web tool (www.mousemodels.org). OMIM diseases are chosen by name, OMIM ID, associated gene or HP annotation. (a) For a particular disease the matched mouse models ranked by phenotypic similarity are displayed. The similarity score used for ranking can be selected from avgIC, maxIC, avgSimJ or maxSimJ. The final tab in the interface shows any known genes for the disease from OMIM (indicated by a red box around the gene in the ranked list) and any associated mouse models from MGI (indicated by a green tick next to the match in the list). (b) Expanding any of the matched rows reveals the details on the matched HPO and MP paired terms that were used to associate the disease and mouse model.

