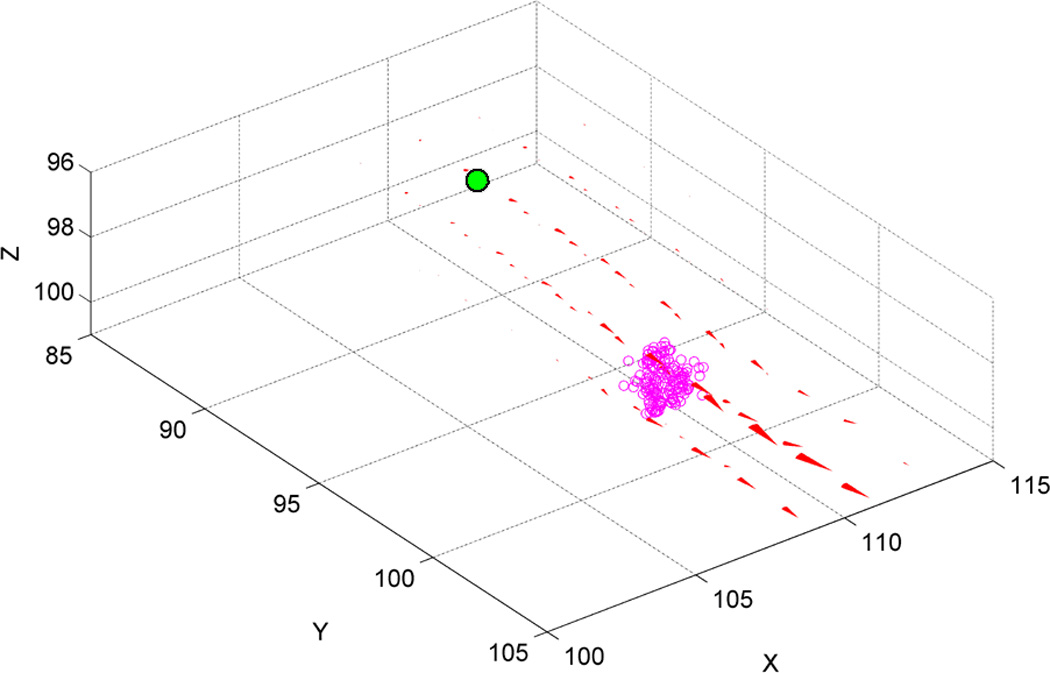
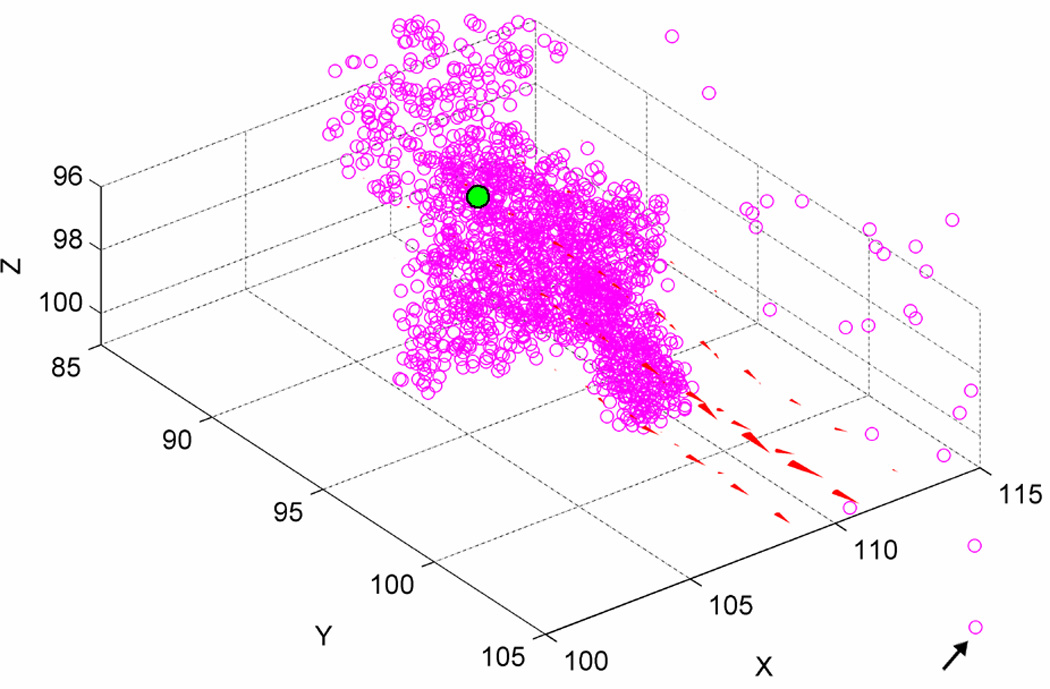
Figure 10.


Example trajectories (open circles) within the flow field (red cones) for a single particle released in the immediate vicinity of the stagnation coordinates of Figure 9. The filled green circle outlined in black indicates the starting coordinates of the particle. (a) High flow rate, Pe = 3710. (b) Low flow rate (Pe = 371); black arrow indicates the final trajectory point visible in this perspective.
