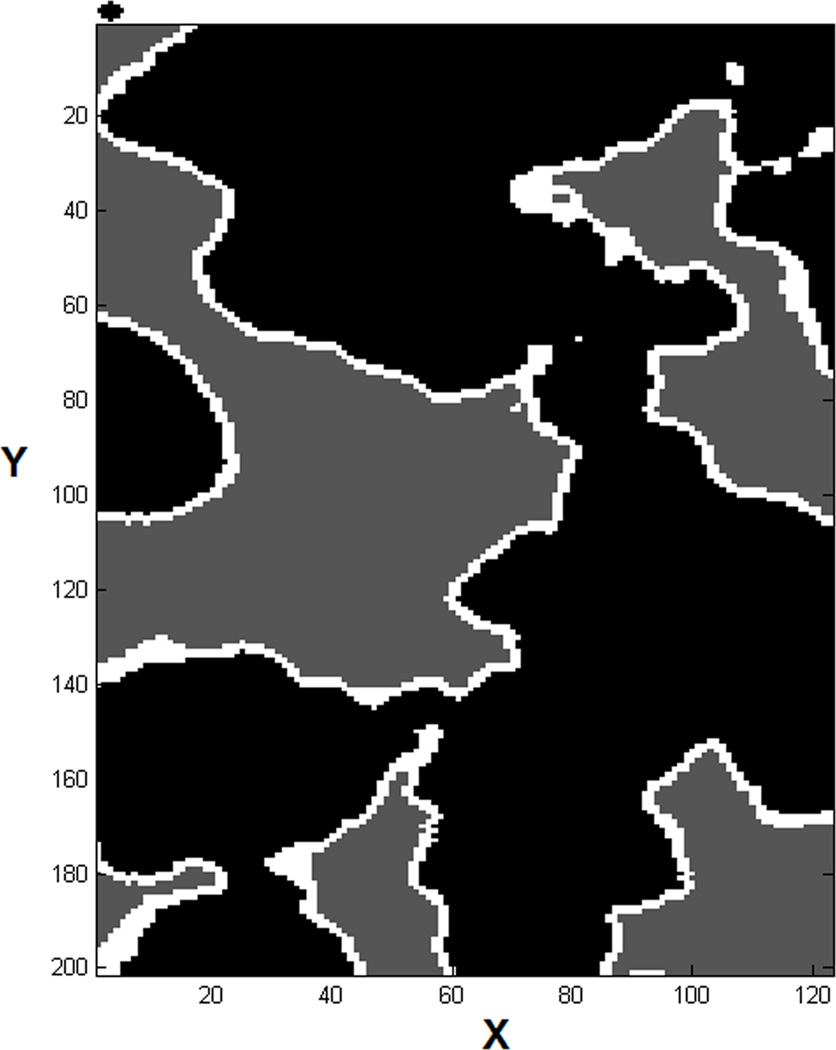
Figure 2.

A two-dimensional portion of a section of the sample geometry eroded by a spherical probe with a diameter of 5 voxels, a cross-section of which is shown to scale above the top left corner of the image. The black regions indicate the pre-erosion solid geometry while the white outline represents the pore geometry that has been transformed into solid after erosion. The remaining pore space after erosion is shown as dark gray.
