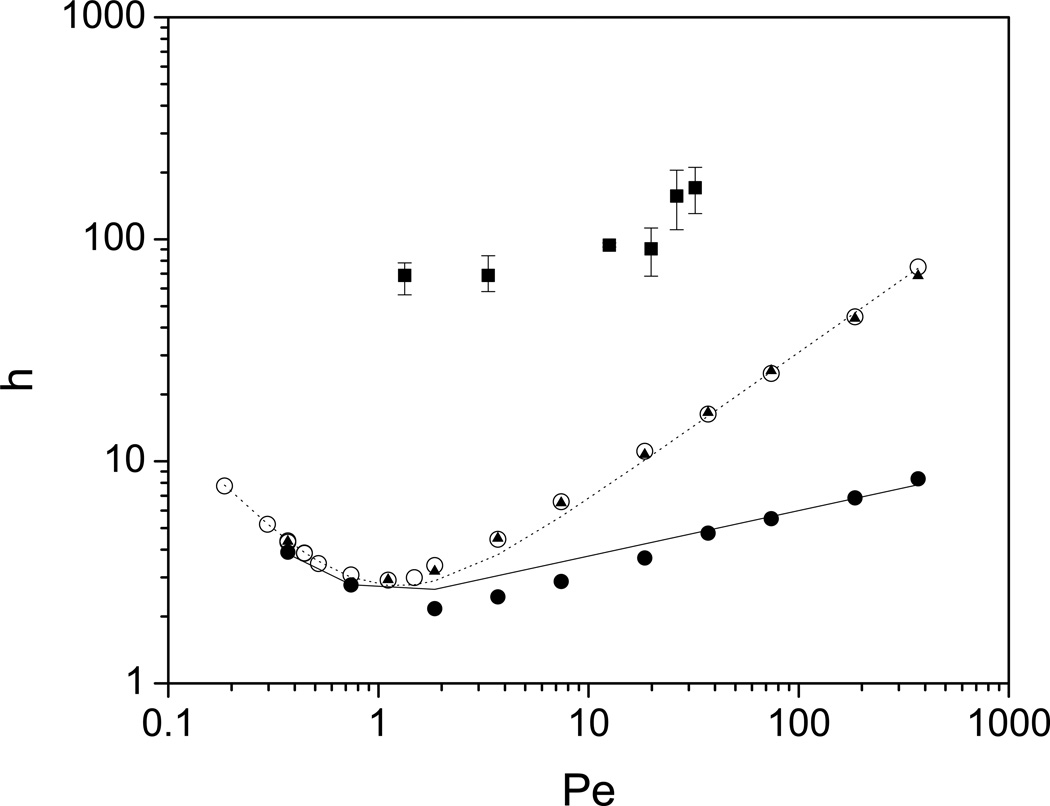
Figure 3.
The plate height curves for point-size probe column simulations with two different time steps, Δt = 10−8 s (▲) and Δt = 10−7 s (○); the single-block simulation set (●); the modified Knox fits to the simulation data (the dashed and continuous lines), and the experimental results (■) of Trilisky et al. for ovalbumin [55].

