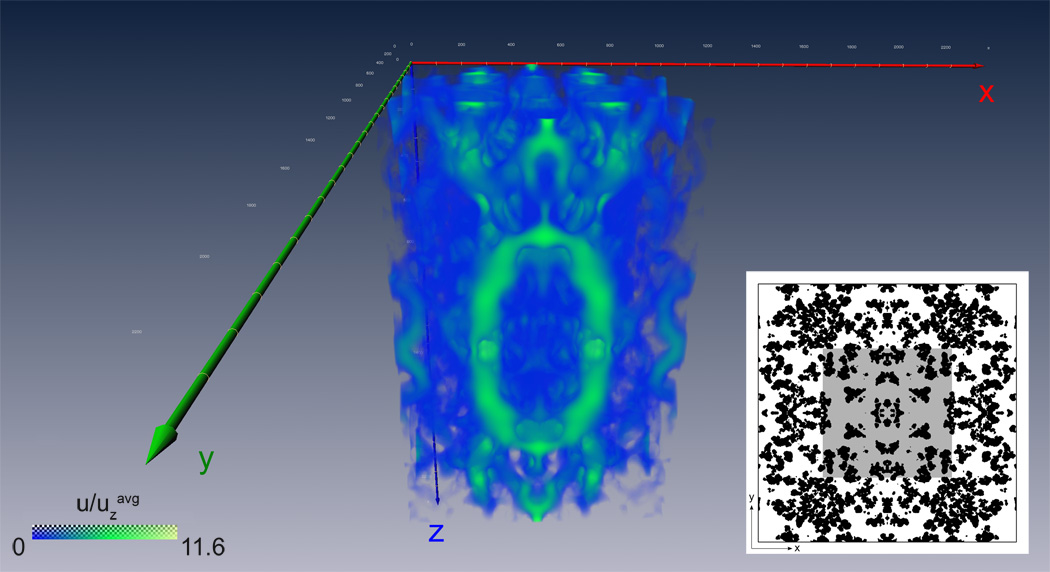
Figure 6.

Plot of scaled u (total velocity) values in the central region of the sample block. Inset displays the topmost x-y cross section of this region as the shaded area on the first section of the sample block for perspective. The values are coded by a combined gradient of color and transparency, with the velocities displayed as opaque green at their highest, a translucent mixture of green and blue at mid-range, and completely transparent, therefore invisible at solid voxels where the total vector is zero. (For interpretation of the references to color in this figure legend, the reader is referred to the web version of this article.)
