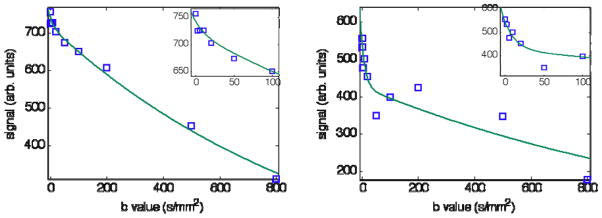
Figure 3.
DW signal versus b-value. ROIs from two livers with low and high values of f (0.03 and 0.22, respectively) are represented. Best fit curves from least squares fitting of Eq 1 are over-plotted on the data assuming fixed Dfast = 0.07 as discussed in the text. Note the low b-value points are well-modeled by the approximation (inset shows a magnification of the low b-value region). Fitted values are given in Table I.

