
Figure 4.

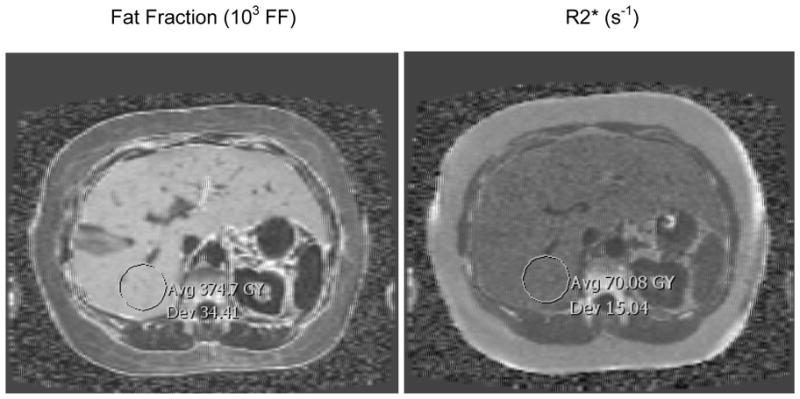
Examples of parametric maps of diffusion (D), perfusion fraction (f), fat fraction (FF) and R2* obtained from the images series in Fig 1 and 2. Note the values have been scaled into a convenient integer range for DICOM compatibility (×106, ×102, ×103 and ×1, respectively). Also there are slight numerical differences compared to Fig 3 due to fitting ROIs rather than each pixel separately; the differences are negligible, e.g. D = 9.5 in Figure 3 versus 9.48 in Figure 4.