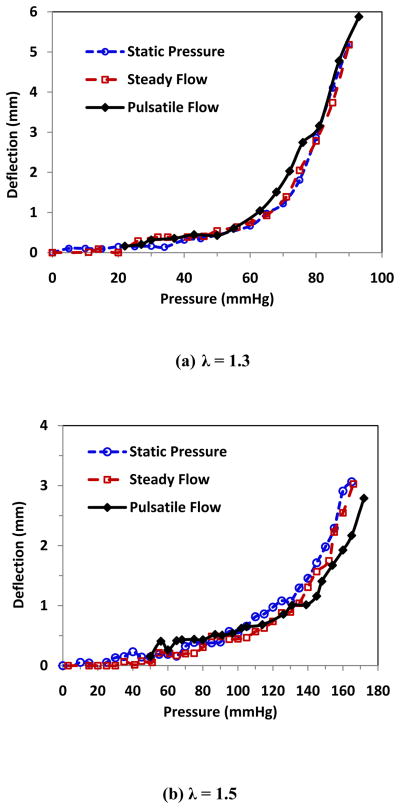
Figure 5.
Comparison of the buckling behavior of an artery under different conditions. The lateral deflection plotted as functions of lumen pressure at stretch ratio (a) λ = 1.3 and (b) λ = 1.5 under static pressure (○), steady flow (□), and pulsatile flow (◆). The maximum deflection was plotted as a function of the peak pressure for pulsatile flow.

