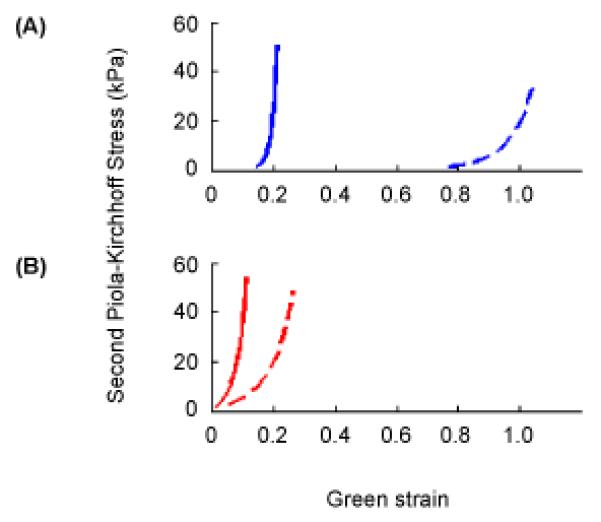
Figure 3.

Stress versus strain curves described by Eqns. 1-3 corresponding to equibiaxial loading at 60 kPa Lagrangian stress in (A) normal human aortic valve leaflet tissue and (B) glutaraldehyde–treated bovine pericardium. On both sets of axes, the solid curve corresponds to the principal fiber direction in the tissue and the dashed curve to the perpendicular direction. Values of the seven model parameters, c and A1 – A6, are 9.7, 49.56, 5.29, −3.12, 16.03, −0.004, −0.02 for normal human aortic valve tissue and 3056, 25.46, 12.10, 5.07, 25.99, 0, 0 for glutaraldehyde-treated bovine pericardium, respectively.
