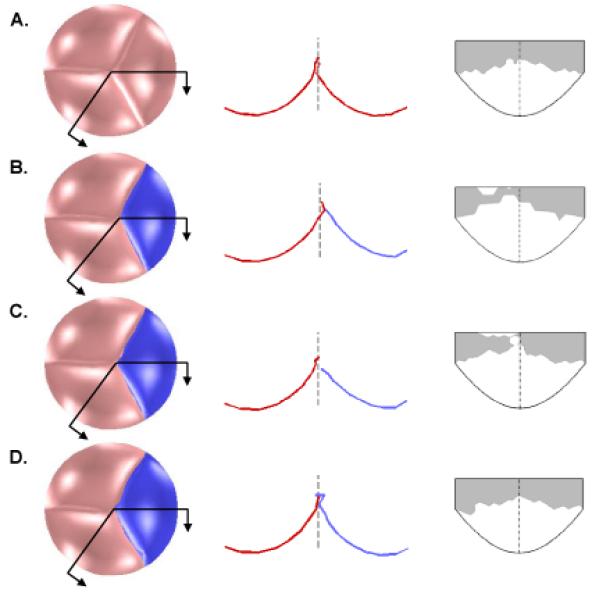
Figure 5.

Results of finite element simulations showing the effect of pericardium graft size on aortic valve closure. First column shows the bottom view of the closed valve loaded with 80 mmHg of pressure. Second column shows the intersection of the leaflets with the two cut planes indicated in the first column, with the dashed line showing the axial center of the valve. In the third column, the coaptation region of a native leaflet is shown in gray, mapped onto an outline of the leaflet in the undeformed configuration. Row A depicts a normal valve (three native leaflets). Row B depicts a valve with one normal leaflet replaced with a pericardial graft (shown darker and in blue) of equal size to the native leaflet. Row C depicts a valve with a graft equal in height but 7% wider than the native leaflet. Row D depicts a valve with a graft 27% higher and 21% wider than the native leaflet.
