
Figure 1.
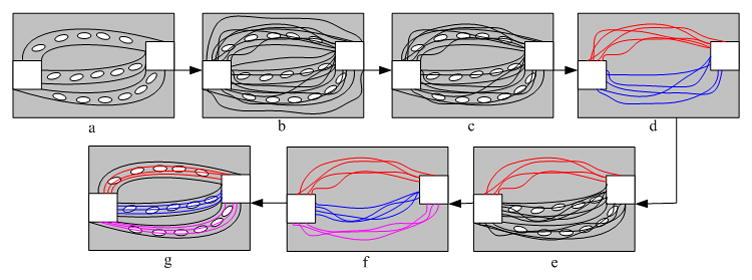
Flowchart of the proposed framework. The white squares denote the ROIs, the gray bundles contain designated fiber pathways, and the white ellipses denote diffusion tensors along the bundle. Fibers clustered into different bundles are shown in different colors.