
Figure 3.
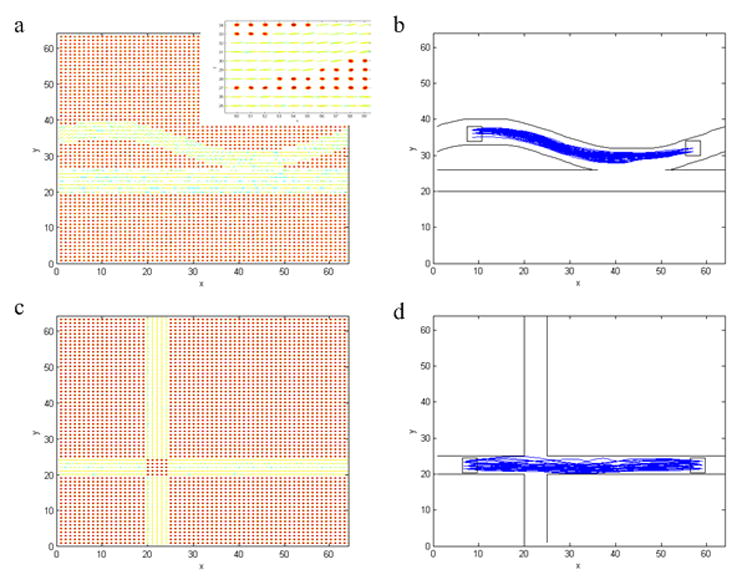
Tests of tracking performance in the presence of complex fiber configurations with synthetic tensor data. The first column shows the synthetic structure of “fiber kissing” (a) and “fiber crossing” (c). The second column (b, d) shows the “fibers” tracked by proposed technique. The ROIs for the tracking experiments are denoted in white squares.