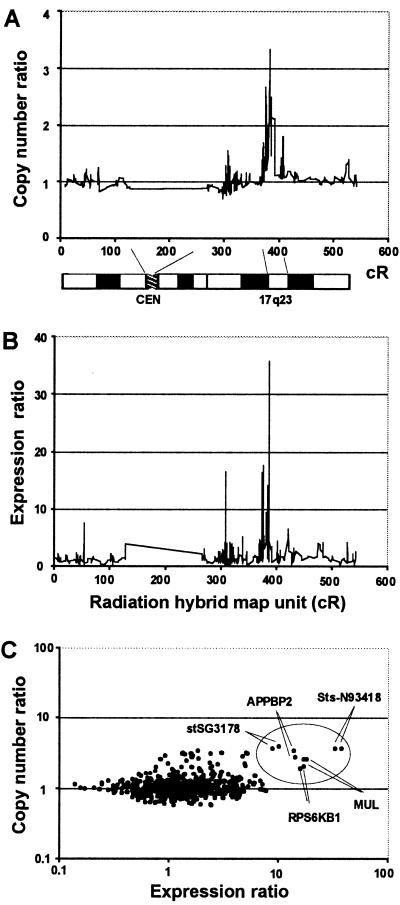
Figure 3.
Copy number (A) and expression (B) survey of chromosome 17-specific genes in MCF7 breast cancer cell line by cDNA microarrays. The copy number and expression ratio data are plotted as a function of the position of the clones in the radiation hybrid map in cR scale. Individual data points are connected with a line. A moving average of three (a mean copy number ratio of three adjacent clones) is shown in A. (C) The copy number ratio as a function of the expression ratio in MCF7 breast cancer cell line. The oval indicates a set of genes that are both highly amplified and overexpressed. Each clone was printed in duplicate on the array, and results from both observations are shown.

