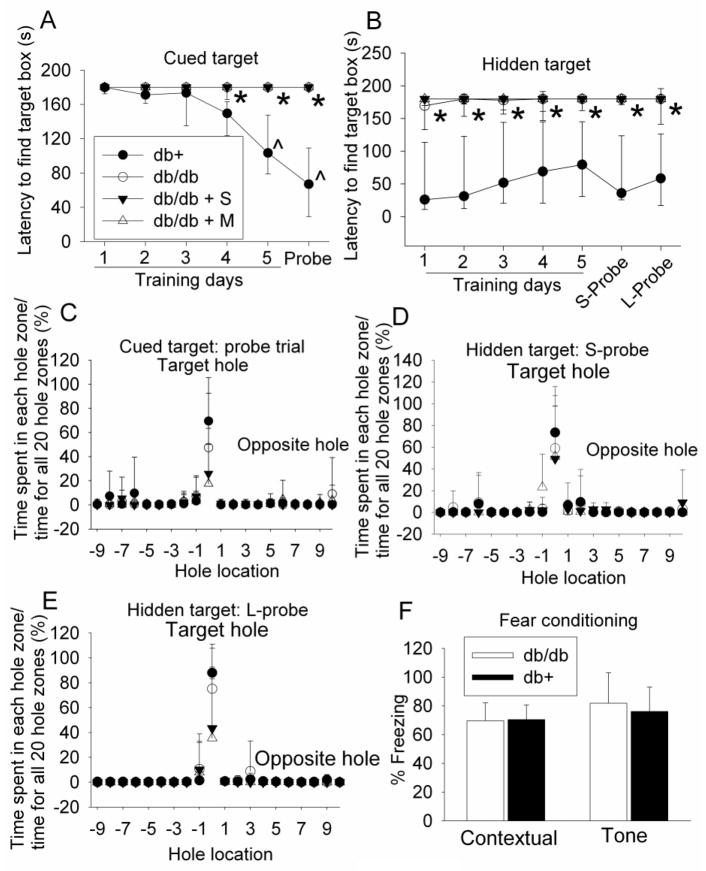
Fig. 1. Performance of mice on Barnes maze and fear conditioning tests.
Seven-week old male db/db mice received or did not receive normal saline or 200 mg kg−1 d−1 metformin in saline for 18 weeks. They were then tested with Barnes maze and fear conditioning tasks. Two forms of Barnes maze tests, cued target and hidden target, were performed. The time for animals to find the target hole during the training sessions and the probe trials is shown in panels A and B. The percentage of the time spent in the zone of each hole in the total time spent in the zones of all 20 holes during the probe trial is shown in panels C, D and E. The percentage of the time with freezing behavior in the total observation time during the fear conditioning tests is shown in panel F. Results are median with 95% confidence interval (panels A and B) or means ± SD (panels C, D, E and F) (n = 8 – 11). * P < 0.05 compared with db+ mice; ^ P < 0.05 compared with the values of the same animals on the first training day. Statistical analysis was performed by Kruskal-Wallis analysis of variance on ranks for data presented in panels A and B and by one way analysis of variance for the fear conditioning data when comparisons were performed among groups. One way repeated measures analysis of variance was used to compare values of the same animals on different training days. db/db + S: db/db mice treated with saline; db/db + M: db/db mice treated with metformin; S-Probe: short-term probe trial; L-Probe: long-term probe trial.

