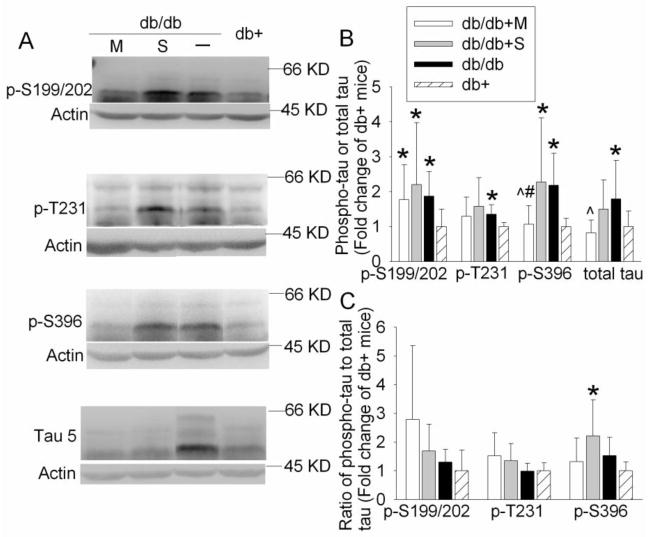
Fig. 2. Expression of phosphorylated tau and total tau in mouse hippocampus.
A representative Western blot is shown in panel A and the graphic presentation of protein abundance quantified by integrating the volume of autoradiograms from 6 – 10 mice for each experimental condition is shown in panels B and C. In panel B, the results of phosphorylated tau and total tau were normalized by the corresponding actin data and then expressed as fold change over the mean value of the db+ control mice in the same experiment. In panel C, the results of phosphorylated tau were normalized by the corresponding actin data. These results were then normalized by the total tau. The final results are expressed as fold change over the mean value of the db+ control mice in the same experiment. All results are presented as means ± SD. * P < 0.05 compared with db+ mice; ^ P < 0.05 compared with db/db mice; # P < 0.05 compared with db/db mice injected with saline. Statistical analysis was performed by one way analysis of variance or Kruskal-Wallis analysis of variance on ranks. db/db + S: db/db mice treated with saline; db/db + M: db/db mice treated with metformin.

