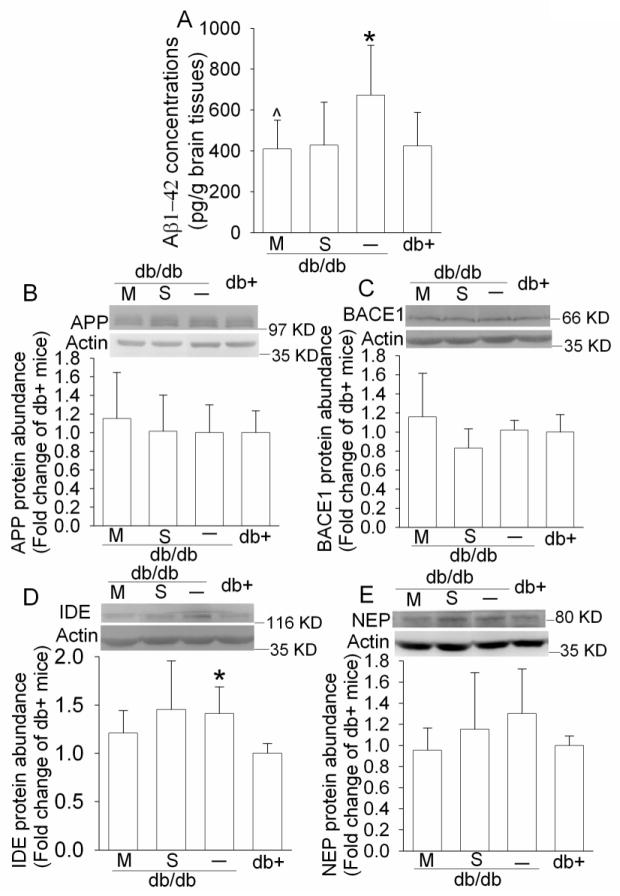
Fig. 7. Expression of Aβ1-42, APP, BACE1, NEP and IDE in mouse hippocampus.
For panel A, results are means ± SD (n = 6 – 8). For panels B, C, D, and E, a representative Western blot is shown in the top panel and the graphic presentation of protein abundance quantified by integrating the volume of autoradiograms from 6 – 8 mice for each experimental condition is shown in the bottom panel. Values in graphs are expressed as fold change over the mean value of the db+ mice in the same experiment and presented as means ± SD. * P < 0.05 compared with db+ mice; ^ P < 0.05 compared with db/db mice. Statistical analysis was performed by one way analysis of variance. M: db/db mice treated with metformin; NEP, neprilysin; S: db/db mice treated with saline.

