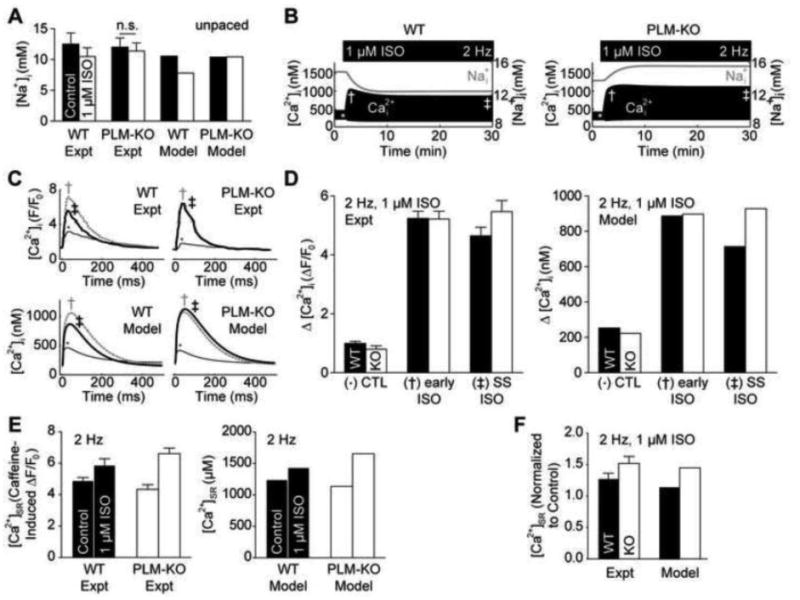
Figure 2.

Model validation of PLM-KO cardiomyocytes using data from Despa et al. [4-5]. A, ISO stimulation reduces [Na+]i in resting WT, but not PLM-KO myocytes [4]. B, Cytosolic Ca2+ adaptation is uniquely present in the WT myocyte and coincides with the drop in intracellular Na+ [5]. C, Model Ca2+ transients from control (*), 2 min. early ISO stimulation (†) and 30 min. steady-state ISO stimulation (‡) are consistent with experimental findings [5]. D, Twitch Ca2+ amplitude decreases in the WT myocyte at steady-state, indicating Ca2+ adaptation [5]. E, ISO-stimulated SR load is larger in PLM-KO myocytes than WT myocytes [5]. F, ISO-stimulated SR loading is similar between model and experiment [5].
