FIG. 5.
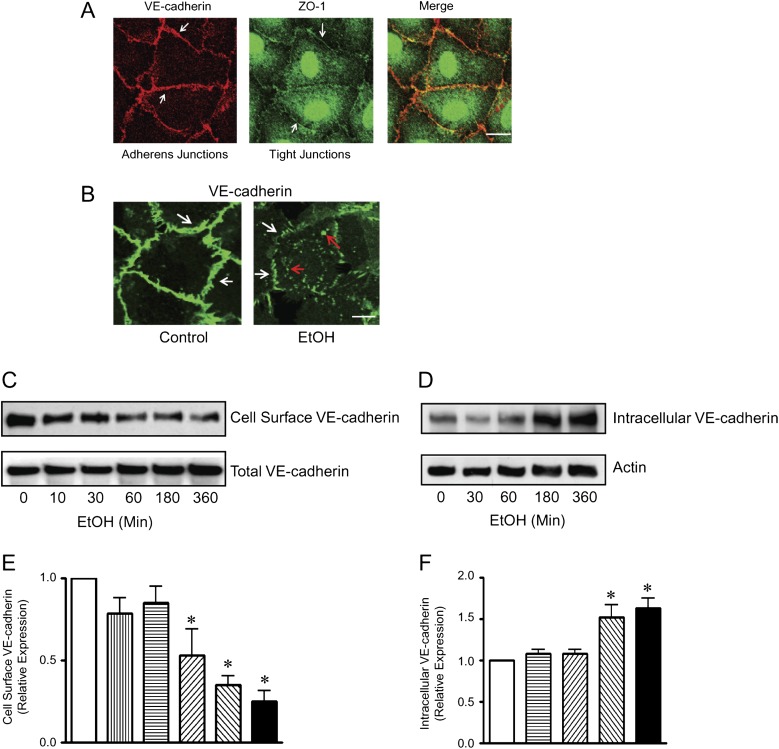
Effect of ethanol on VE-cadherin trafficking. (A): Adherens junctions and tight junctions in HUVECs were visualized by VE-cadherin and ZO-1 immunofluorescent staining, respectively, as described under the Materials and Methods section. Scale bar = 10 μm. (B): HUVEC monolayer was exposed to ethanol (0 or 200 mg/dl) for 4 h. VE-cadherin was visualized by immunofluorescence microscopy. Arrows indicate either the junctional or cytoplasmic VE-cadherin. Scale bar = 5 μm. (C): HUVEC monolayer was exposed to ethanol (0 or 200 mg/dl) for indicated times and incubated with a cell impermeable marker sulfo-NHS-SS-biotin at 0°C for 1 h. Cell lysates were collected, and biotin-labeled protein was precipitated as described under the Materials and Methods section. The expression of cell surface VE-cadherin was identified using a polyclonal antibody directed against the extracellular domain of human VE-cadherin. The expression of total VE-cadherin was also examined. (D): HUVEC monolayer was exposed to ethanol (0 or 200 mg/dl) for indicated times and treated with trypsin-EGTA as described under the Materials and Methods section. The cell lysates were collected, and the internalized VE-cadherin (trypsin-resistant) was identified using a polyclonal antibody as described above. The expression of actin was used as a loading control. (E and F): The relative expression of cell surface VE-cadherin (E) and intracellular VE-cadherin (F) was determined by densitometry and normalized to the total VE-cadherin (E) or actin (F), respectively. * denotes a statistically significant difference from untreated controls (p < 0.05). These experiments were replicated three times.

