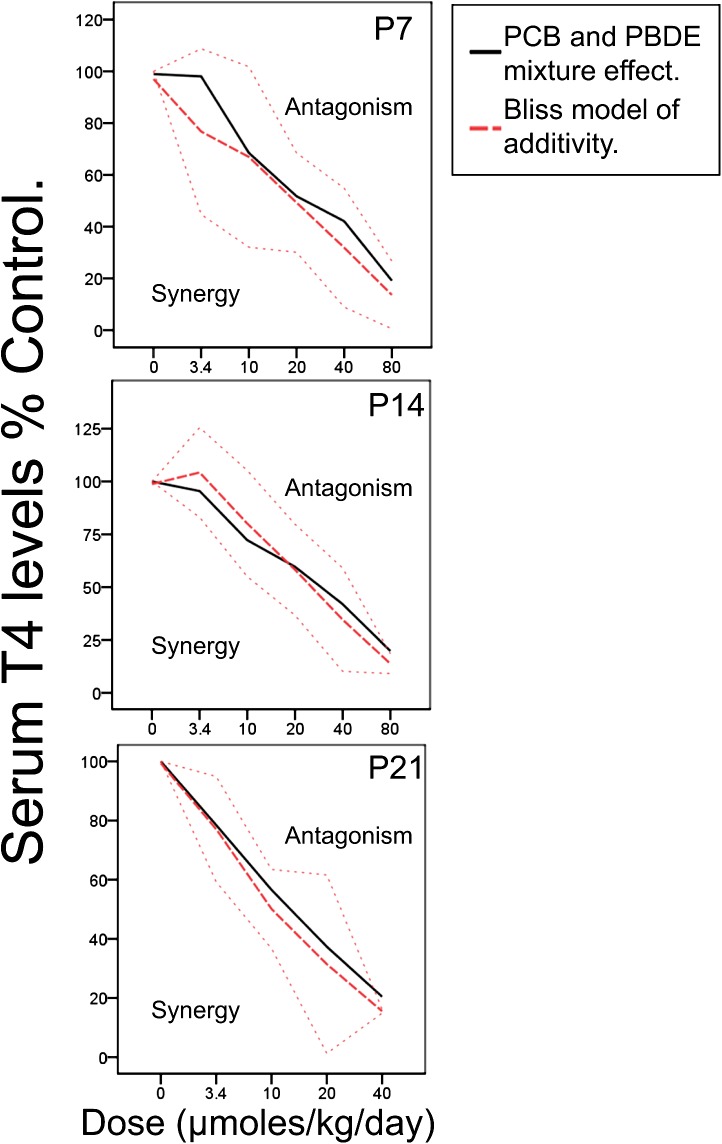
FIG. 2.
The line graphs show T4 levels as a percent of control values in offspring exposed to a mixture containing equimolar doses of PCBs and PBDEs, to yield a total dose of 3.4, 10, 20, 40, or 80 μmol/kg/day at p 7, 14, and 21. The predicted additive effect of the mixture using the Bliss model approach is shown in the red dashed line (color available online). The actual effect of the mixture is shown in the black line. Above and below the red dotted lines are ± 2 SDs from the predicted additive effect. Above the red dotted line is where we would expect to find agonistic interactions between the two contaminants and below the red dotted line is where we would expect to find synergistic interactions between the two contaminants (Borgert et al., 2005). There is no difference between the actual effect of exposure to the mixture and the predicted additive effect generated with the Bliss model.

