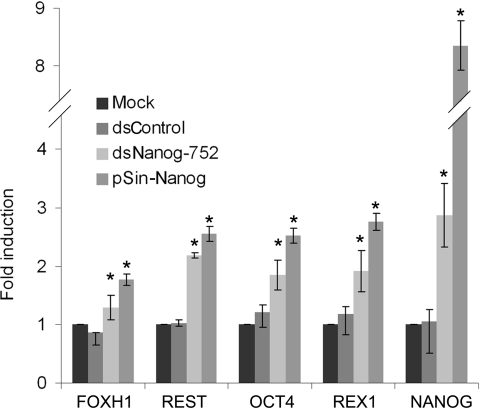
Figure 4. dsNanog-752 induces expression of downstream NANOG-regulated genes.
NCCIT cells were transfected with 50 nM concentrations of the indicated saRNAs for 96 h. Mock samples were transfected in the absence of saRNA. Expression of NANOG and its downstream genes (OCT4, REX1, REST and FOXH1) was assessed by quantitative RT–PCR and normalized to GAPDH. Results are fold changes relative to mock transfections (means±S.D. for three independent experiments). *P< 0.05 compared with the mock. cDNA generated from NCCIT cells transduced with lentivirus (pSin-Nanog) served as a positive control for NANOG overexpression.

