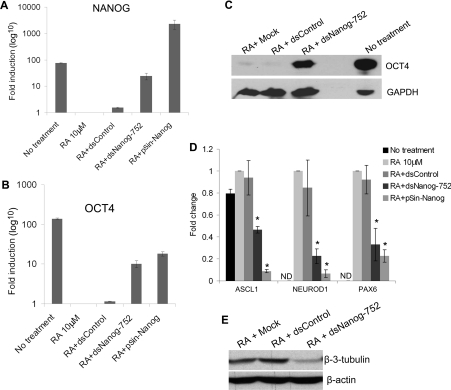
Figure 6. dsNanog-752 antagonizes RA-induced differentiation in NCCIT cells.
NCCIT cells were cultured with 10 μM RA and co-treated with 50 nM concentrations of the indicated saRNAs every 96 h for 14 days. NCCIT cells transduced with lentivirus (pSin-Nanog) served as a positive control for NANOG overexpression. mRNA expression levels of NANOG (A) and OCT4 (B) were assessed by quantitative RT–PCR and normalized to that of GAPDH. Results are fold changes relative to the 10 μM RA treatment (means±S.D. for three independent experiments). (C) Protein levels of OCT4 were detected by immunoblot analysis. GAPDH served as a loading control. Representative blot of n=2. (D) Neural markers ASCL1, NEUROD1 and PAX6 were assessed by quantitative RT–PCR and normalized to that of GAPDH. Results are fold changes relative to the 10 μM RA treatment (means±S.D. for three independent experiments). * P< 0.05 compared with RA. ND, not detectable. (E) Protein levels of β-3-tubulin were detected by immunoblot analysis. β-actin served as a loading control. Representative blot of n=2.

