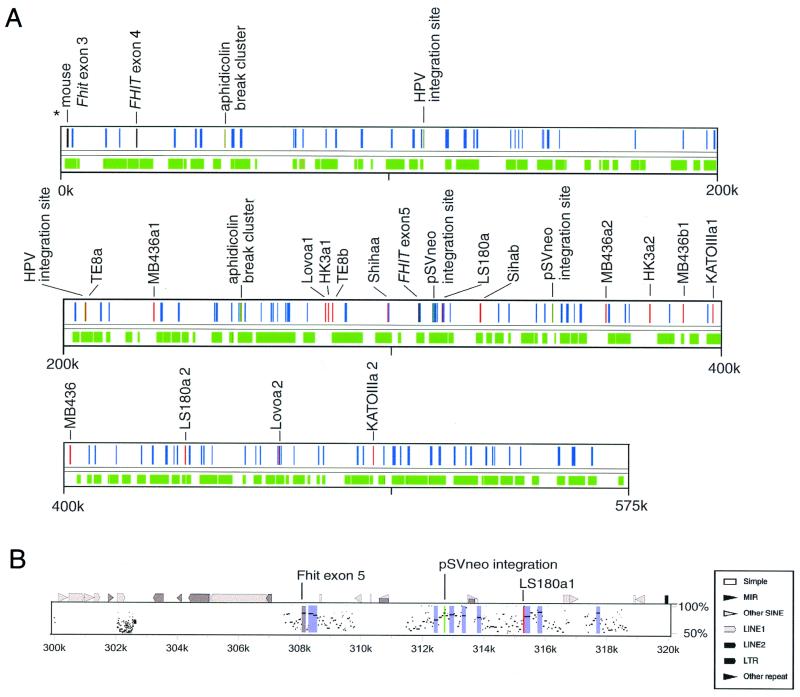
Figure 3.
Alignment and landmarks. (A) The relation between landmarks of this region and conserved regions. Red, gray, and dark green bars indicate the positions of break points of cancer cell lines, FHIT gene exons, and aphidicolin break cluster or integration sites, respectively. Green zones are the regions aligned with mouse sequence, and blue zones are HCRs. (B) Percent identity plots in 20 kbp of the human sequence around exon 5. The top line shows the position of repeats (by repeatmasker) and several land marks. The gray zone is the region of FHIT exon 5, and the blue zones are HCRs. Note that FHIT exon 5 (coding exon) was 85% homologous to mouse sequence and that two landmarks, pSVneo integration sites and LS180a break point, are located within or near HCRs.

