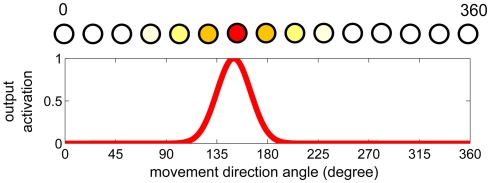
Figure 1.
Example of a dynamic neural field. The top graph shows the topological encoding of a movement direction in degrees of heading (0–360). The bottom graph illustrates a possible output activation (see also neuron colors in top graph) that could be the result of the neural field dynamics. In this particular case the output activation represents a movement heading of approximately 150° as the neuron corresponding to this direction has the highest output activation.

