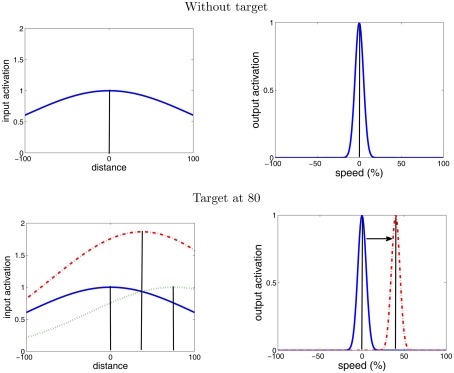
Figure 4.
“Moving blob” behavior in the V map. The top graphs show the behavior of the V map without a target being selected. The input activation for the V map is the Gaussian activation with its maximum in the center of the field causing the output activation of the V map to establish a peak at the center. With a target present (bottom graphs) its activation (dashed green line) is added to the activation around the center (blue line) resulting in a combined activation (red dashed line). This new input activation causes the output activation to move toward the new input maximum leading to an increase of the end effector’s speed (“Moving blob” behavior).

