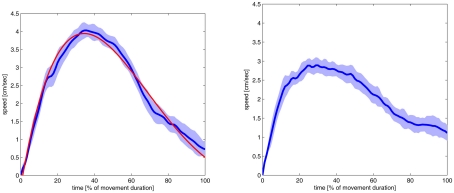
Figure 5.
Velocity profiles of the simulated movements to the top center position of Figure 6. The profiles are shown with their standard deviation (light blue area) and the point where the initial latency end and the movement starts (black line). Negative time values represent the initial latency. The movement ended at 100%, the time scale goes slightly higher than this value, because the dark blue line represents the moving average of 10 time slices of the movement. The result on the right side was produced with a standard topological encoding in the V map of the Movement Velocity Control module. On the left a non-linear encoding was used. This encoding schema let to better reaching movements. The red line documents the outcome of the VITE-model fitted to the robot arm behavior (see main text for detailed discussion). Both velocity profiles are the average of 25 trials.

