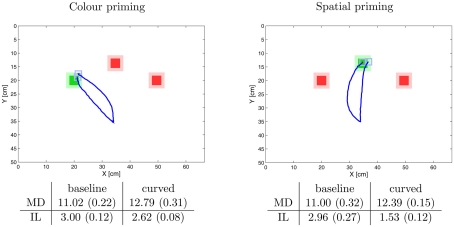
Figure 7.
Example trajectories with measured time intervals of the simulation of the odd-color experiment. The trajectories are mean trajectories of five trials. The time intervals are also the average times from five trials in seconds. The figures in brackets indicate the standard deviation. The abbreviations stand for initial latency (IL) and movement duration (MD). The results demonstrate that the model can successfully direct to the robot arm to the odd-color target. The “curved” trajectories result from the preactivation of the spatial map (spatial priming, on the right) and the color map (color priming, on the left). In both conditions, compared to the straight trajectories the initial latency decreases and the movement times increases matching the experimental data by (Song and Nakayama, 2008). Interestingly the effect on the initial latency is stronger in spatial priming than in color priming. This effect is discussed in the main text.

