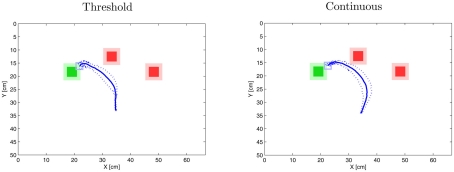
Figure 8.
Comparison of “ continuous” vs. “ threshold” hypothesis (Experiment 3). The result on the left shows the outcome of the threshold hypothesis. Note that in this setting the trajectory veers toward the middle or the right distractor randomly depending on the noise in the DNFs. For the above figure only the trajectories toward the middle distractor were chosen. The trajectory on the right is the effect of the “continuous” hypothesis (see main text for detail). Each mean trajectory shows the results from 5 trials. The broken lines documents the standard deviation.

