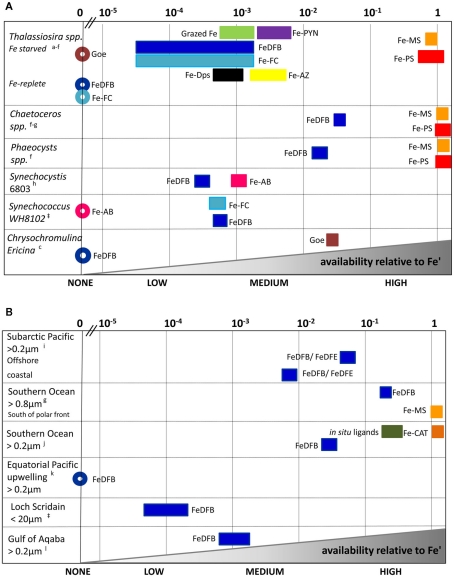
Figure 5.
Relative scale of Fe availability established from phytoplankton uptake rates obtained for cultures (A) and natural assemblages (B). By converting experimental data to uptake-rate constants, and normalizing it further relative to Fe’, comparisons across organisms, Fe-substrates and environments are made possible (see text and Figure 4 for details). Different Fe-complexes are presented as different colors, while bar length represents variations among experiments, and circles denote no uptake. Abbreviations: Goe, goethite; DFB, desferrioxamine B; AB, Aerobactin; FC, ferrichrome; PYN, Porphyrin; MS, Monosaccharides; PS, Polysaccharides; AZ, Azotochelin; DPS, DNA binding protein from starved cells (iron storage proteins); CAT, Gallocatechin; DFE, desferrioxamine E. See Appendix for supporting data and Figure 3 for location descriptions. References: aShaked et al. (2005), bChen et al. (2008:1], cNodwell and Price (2001), dKustka et al. (2005), eMaldonado and Price (2001), fHassler and Schoemann (2009), gHassler et al. (2011b), hKranzler et al. (2011), iMaldonado and Price (1999), jMaldonado et al. (2005), kWells et al. (1994); lLis and Shaked (2009), ‡Lis and Shaked, unpublished.

