Figure 1.
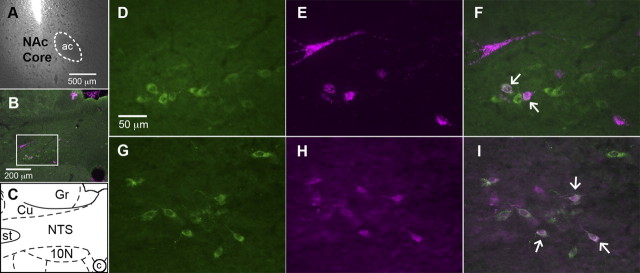
Representative images of fluorescent immunostaining and retrograde tracing of the projection from NTS neurons to NAc. A, NAc image showing the location and minimal spread of RetroBead injection (ac, anterior commissure). B, C, A low-magnification image of the caudal NTS (B) and a corresponding diagram (C) based on Paxinos and Watson (2007) are provided for orientation (Cu, cuneate nucleus; Gr, gracile nucleus; st, solitary tract; 10N, dorsal motor nucleus of the vagus; c, central canal). Higher-magnification images are taken from the area inside the white box in B. B, D, F, G, I, GLP-1 neurons (green cytoplasmic fluorescence) are visible in the NTS. B, E, F, H, I, Magenta cytoplasmic fluorescence identifies neurons that are retrogradely labeled by RetroBeads (B, E, F) or Fluorogold (H, I). B, F, I, Colocalization of GLP-1 and tracer is shown by merging images of GLP-1 and tracer. Arrows indicate several double-labeled cells.

