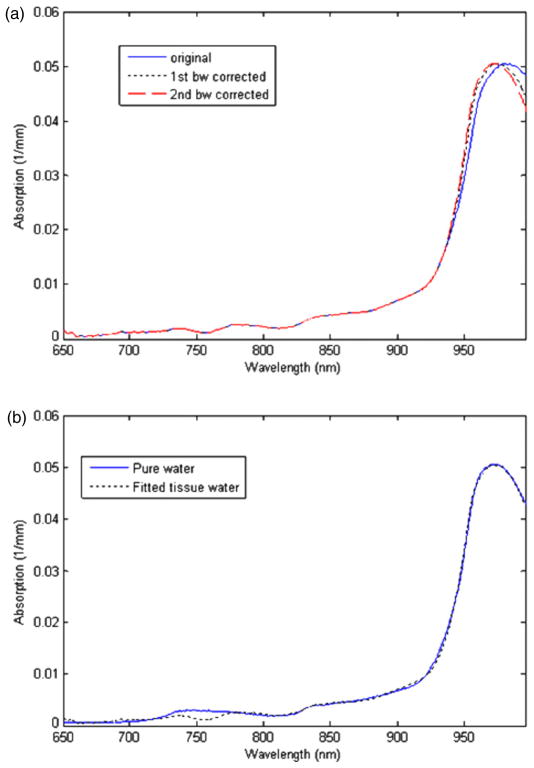
Figure 3.
(a) Before and after first (fine dashed line) and second (coarse dashed line) bound water effect corrections. (b) Bound water corrected tissue water spectrum fit to a pure water spectrum at a specified temperature. The temperature of the best-fit pure water spectrum is the temperature of the measured tissue volume.

