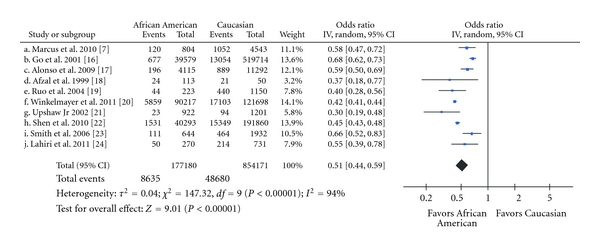
Figure 2.

Meta-analysis of the association between African American race and prevalence of atrial fibrillation. The squares represent the odds ratio and their sizes are proportional to the study sample; the horizontal lines represent 95% confidence intervals (CI).
