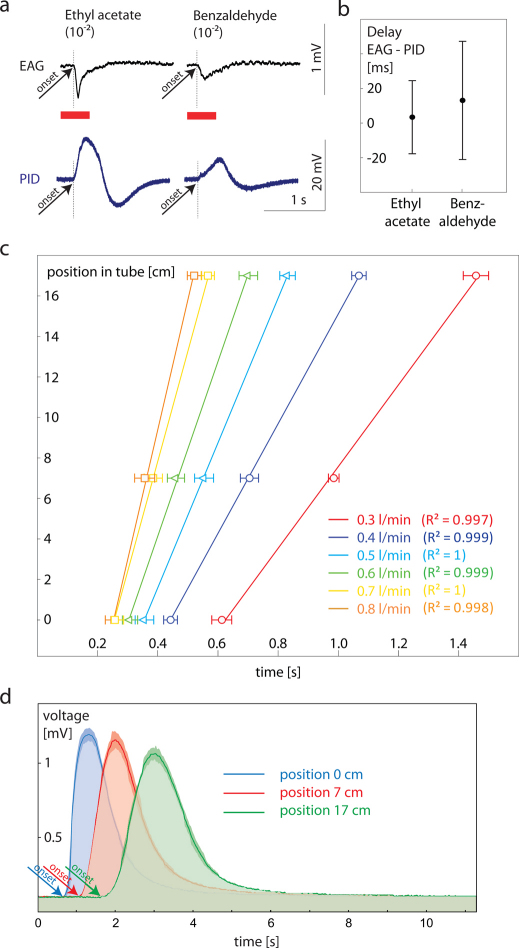
Figure 2. Stimulus characterization.
(a) Simultaneous PID and EAG recordings of odor pulses.We simultaneously recorded PID and EAG signals at different positions in the tube (5 cm, 10 cm and 15 cm) to 500 ms pulses of ethyl acetate and benzaldehyde (10–2 dilution). Both signals were recorded simultaneously using a 4-channel USB acquisition controller, type IDAC-4 (Ockenfels SYNTECH GmbH, Germany). Arrow heads depicts onset of responses. Please note that the Syntech software processes the analogue input of the PID signal with the same filters as used for EAG processing. Therefore, the course of the PID signal does not reflect the real but a processed course over the whole time elapse. However, it informs about the onset of the signal (arrow head). (b) Delay between time of onset in EAG and PID recordings after stimulation with ethyl acetate and benzaldehyde (n = 10). We found no systematic delay between both methods applied (n = 10). (c) Calibration for speed of stimulus movement within the tubes (n = 10). We conducted PID measurements at three positions in the tube for five different air flows. Linear correlation between time and pulse position within the tube ensures that the stimulus is moving with a constant and predictable speed. (d) Shape of pulses depending on position in tube (n = 5 for each measurement). Solid line, median; shaded area, interquartile range.

