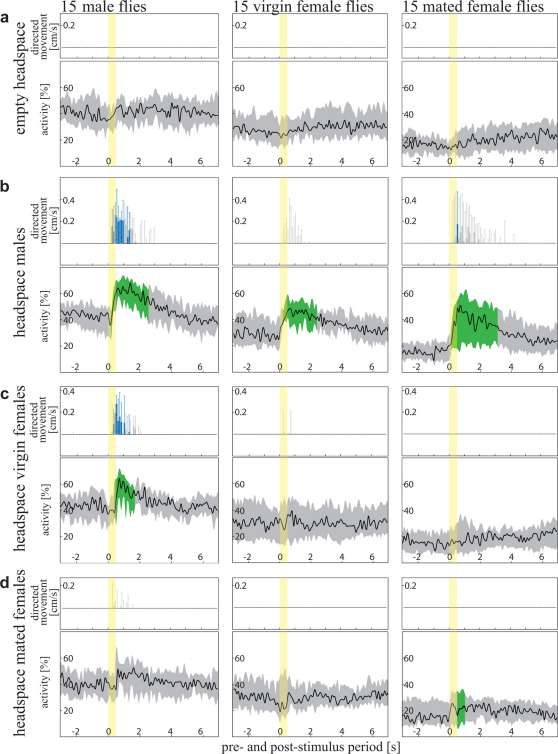
Figure 5. Responses of male, virgin female, and mated female flies to fly odors.
(a–d) Tested headspaces of no flies (a), male (b), virgin female (c), and mated female (d) flies. Top graphs, boxplot representation of odor-induced changes in upwind speed of 15 flies; black line, median upwind speed; box, interquartile range; whiskers, 90th and 10th percentiles. The blue box-plots depict significantly increased upwind speed compared to the upwind speed during the solvent control situation within the corresponding 100-ms time frame; red box-plots depict significantly decreased upwind speed compared to the upwind speed during the solvent control situation within the corresponding 100-ms time frame, grey box-plots depict no significant difference in upwind speed. Low graphs, undirected activity of 15 flies; black line, median activity; shaded area, interquartile range; green, significantly increased activity; orange, significantly decreased activity. Yellow area, 500 ms odor stimulus. For statistical analysis see Methods section.

