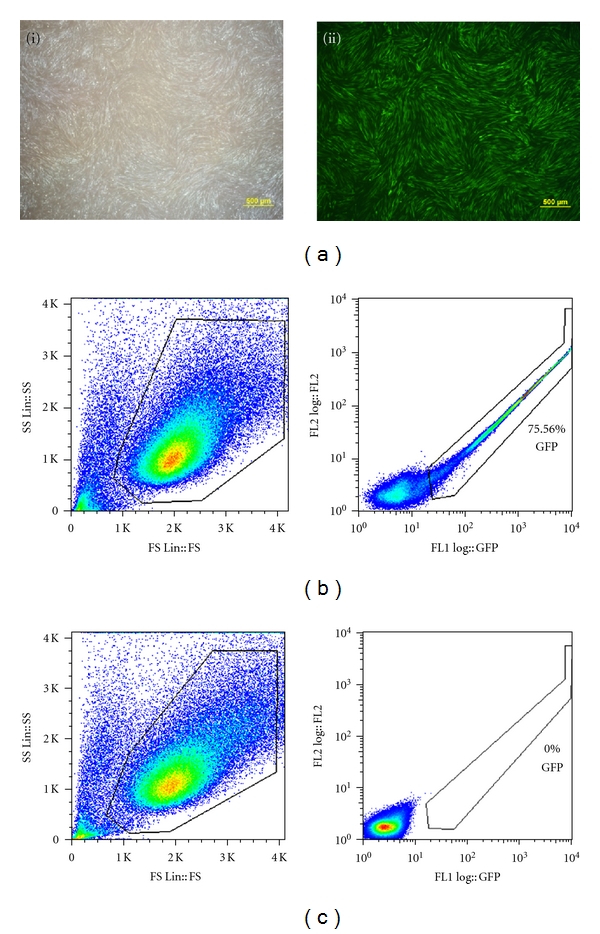
Figure 1.

FACs analysis showing GFP fluorescence in adult equine fibroblasts following pMX-GFP viral transduction. (a) GFP fluorescence in AEFs following GP2293 mediated retroviral transduction, scale bar 200 μM. (i) Bright filed. (ii) Green filter. FACs profile of GFP fluorescence, (b) Retroviral transduction using GP2 293 packaging cell. (c) Control EAFs.
