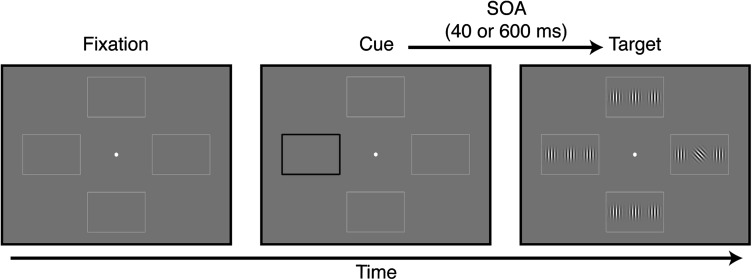
Figure 1.
Visual cueing task. At the beginning of each trial, one of the 4 peripheral rectangular frames became black and thicker. Following a SOA of either 40 or 600 ms, the target appeared in one of the 4 locations (25% probability at each location). The target was a Gabor patch oriented ±45° relative to vertical. Subjects indicated target orientation as quickly and accurately as they could by pressing one of 2 buttons.

