Figure 3.
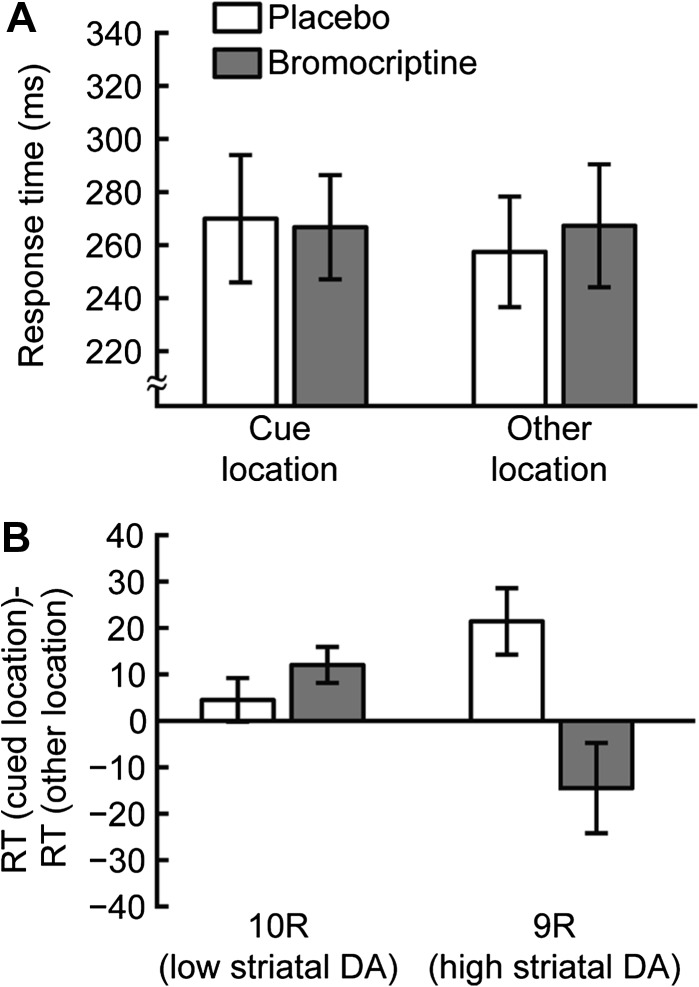
Long SOA blocks. (A) Average RTs for 600 ms SOA blocks. RTs are shown for the cue location (left) and other locations (right) for sessions in which placebo (white) or bromocriptine (gray) was administered. (B) Cueing effects. Data are plotted separately for 10R (left) and 9R subjects (right) for sessions in which placebo (white) or bromocriptine (gray) was administered. Positive values indicate IOR. In placebo sessions, 9R subjects had greater IOR than 10R subjects. Bromocriptine increased IOR in 10R participants and abolished IOR in 9R participants. Error bars are standard error of the mean within group/condition.

