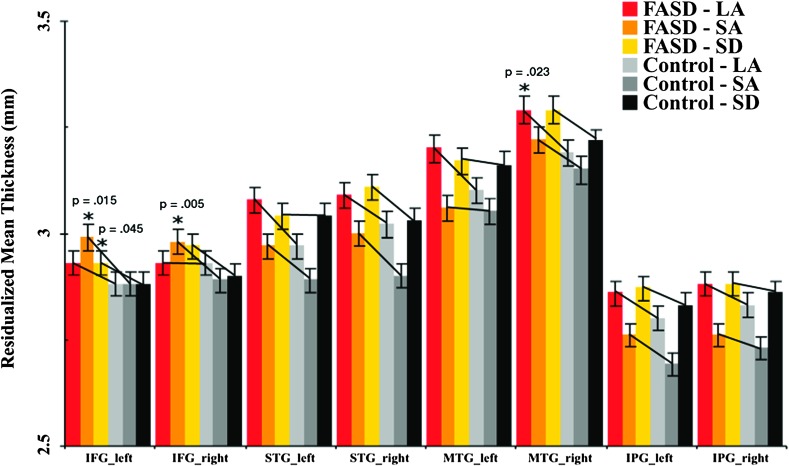
Figure 3.
Average thickness of the left and right inferior frontal gyrus (IFG), superior temporal gyrus (STG), middle temporal gyrus (MTG), and the inferior parietal gyrus (IPG) of the FASD and control subjects within each site, corrected for age, gender, and total brain volume. The vertical lines represent the standard error bars.

