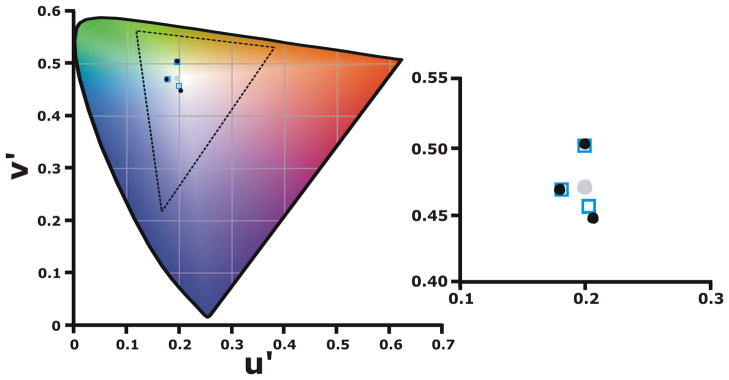
Figure 2.
Cambridge Colour Test results. The filled gray circle represents the chromaticity of the background, filled black circles are the results from the double carrier proband (II-4), and the open squares are the average results from 11 normal subjects. The axis of one of the hues tested was along a tritan confusion line from background gray to violet (u′= 0.1990, v′= 0.5470, Tritan). The second hue tested was along a line from an average unique green for our subjects (u′=0.2230, v′= 0.3870, Deutan) to gray. The third was from an average unique blue to gray (u′=0.1210, v′= 0.4690, Protan). Shown on the right is a magnified view of the data, demonstrating the coincidence of the proband’s data with that of the controls.

