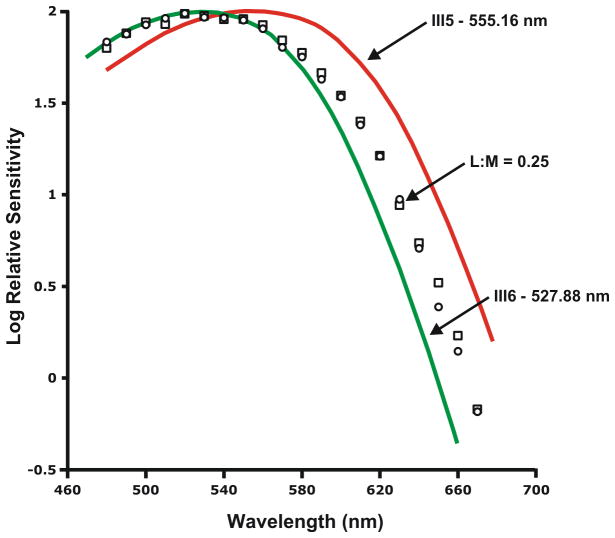
Figure 3.
L:M cone ratio. Flicker-photometric ERG was used to measure the spectral sensitivity of the compound heterozygote (II-4), and her sons’ (III-5 and III-6) measured spectral sensitivities were used to interpret their mother’s L:M ratio. The red and green curves are the ERG derived spectral sensitivity of III-5, and III-6 respectively. Open circles and open squares represent data from the mother’s right and left eye respectively and indicate an L:M ratio of about 0.25 (20%L).

