Figure 6.
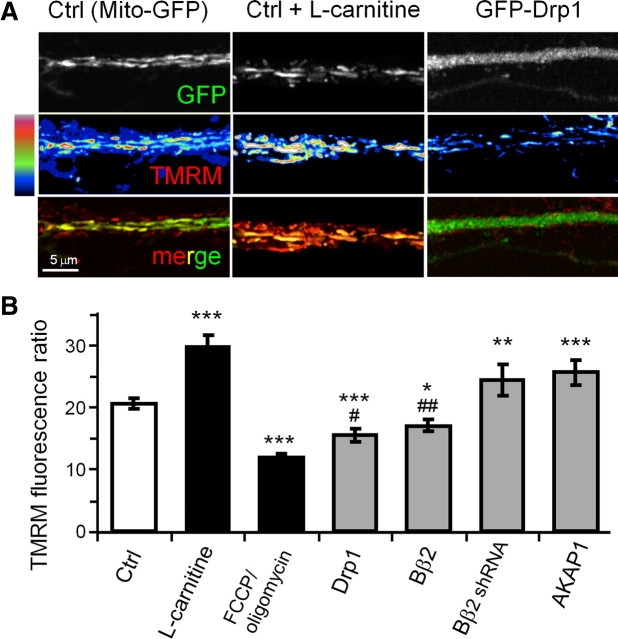
Mitochondrial fission/fusion determines mitochondrial membrane potential. A, B, Hippocampal neurons virally transduced at 12 DIV with GFP or the indicated GFP fusion proteins were labeled with 20 nm TMRM and imaged live by confocal microscopy at 18 DIV. FCCP/oligomycin (0.5 μm/2 μm) and l-carnitine (1 mm) were added 10 min before imaging. A, Representative images of primary dendrites with TMRM fluorescence intensity shown on a pseudocolor scale. B, Relative mitochondrial membrane potential was expressed as the ratio of background-subtracted TMRM fluorescence in mitochondria over the adjacent dendritic cytosol and plotted as means ± SE of 3–6 experiments with 36–65 neurons/condition; *p < 0.05, **p < 0.01, ***p < 0.001 compared to control (Ctrl; GFP) and #p < 0.05, ##p < 0.01 compared to FCCP/oligomycin.

