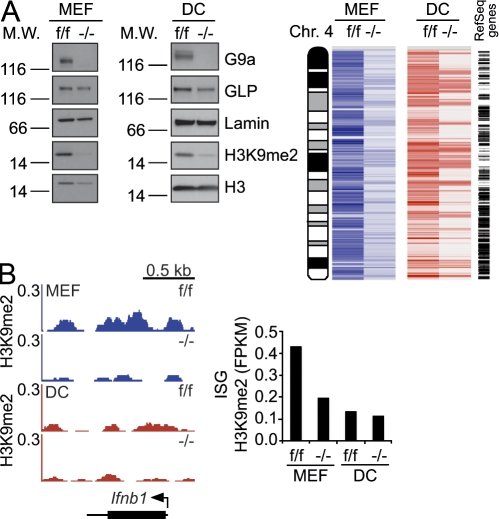
Figure 2.
Differential impact of G9a deficiency on H3K9me2 at Ifnβ and ISGs in MEFs and DCs. (A, left) The expression levels of G9a, GLP, and H3K9me2 in control (f/f) or G9a deficient (−/−) cells were measured by Western blotting. Lamin B and Histone H3 serve as loading controls. (A, right) The heat map shows distribution and levels of H3K9me2 along chromosome 4 in G9af/f and G9a−/− MEFs and DCs as determined by ChIP-Seq. A condensed map of RefSeq genes is to the right. (B) Impact of G9a deficiency on H3K9me2 at the Ifnb1 (left) and ISG loci (right) in MEFs and DCs. H3K9me2 distribution and levels at the Ifnb1 locus in MEFS or splenic DCs were determined by ChIP-Seq analysis. The mean FPKM values of H3K9me2 levels at ISG promoters in G9af/f and G9a−/− MEFs and DCs were quantified by ChIP-Seq. Data are representative of two independent experiments for MEFs and one experiment for DCs.

