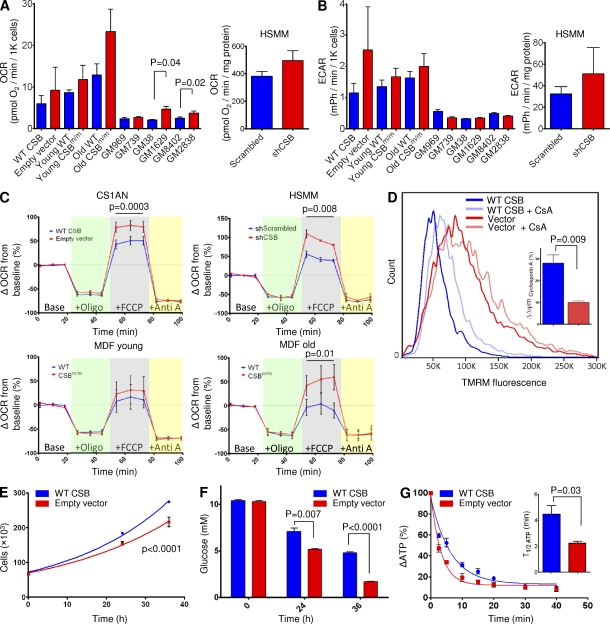
Figure 3.
CSB deficiency increases cellular metabolism. (A and B) Oxygen consumption rates (OCRd; A) and extracellular acidification rates (ECARd; B) were increased in CSB-deficient cells. CS1AN: CSB patient cell line expressing an empty vector or a vector containing WT CSB. HSMM: HSMMs expressing scrambled shRNA or shRNA targeted to CSB. MDF: MDFs isolated from young and old CSBm/m mice. Primary CSB patient fibroblasts (GM739, GM1629, and GM2838) and healthy age-/gender-matched controls (GM969, GM38, and GM 8402) are shown. Blue are cells expressing WT CSB. Red are CSB-deficient cells (n = 3–7; data are represented as mean ± SEM). (C) FCCP-uncoupled respiration was measured by sequential addition of oligomycin (green background), FCCP (gray background), and antimycin A (yellow background; n = 3–7; data are represented as mean ± SEM). (D) Mitochondrial membrane potential in CS1AN cells measured by 20 nM TMRM staining and flow cytometry and its responsiveness to treatment with cyclosporin A (CsA). Inset: quantification of the response to cyclosporin A (n = 3; data are represented as mean ± SEM). (E) Growth curve of CS1AN cells expressing either an empty vector or WT CSB. (n = 3; data are represented as mean ± SEM). (F) Glucose concentration was measured in the media of CS1AN cells expressing WT CSB or an empty vector (n = 3; data are represented as mean ± SEM). (G) ATP consumption of CS1AN cells expressing WT CSB or an empty vector after inhibition of ATP production with 100 mM 2-deoxyglucose and 1 µM oligomycin. Inset: half-life of ATP (n = 3; data are represented as mean ± SEM).

