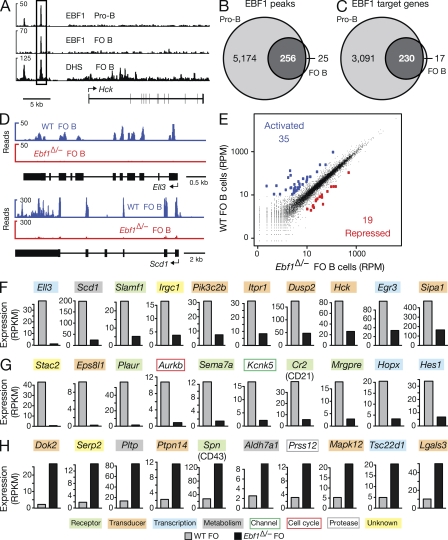
Figure 7.
Genome-wide analysis of regulated EBF1 target genes in FO B cells. (A) EBF1 binding at the Hck locus. EBF1-binding sites were identified by ChIP-sequencing in short-term cultured Rag2−/− pro–B cells and mature FO B cells, which were MACS-sorted from lymph nodes of WT C57BL/6 mice. DNase I hypersensitive (DHS) sites of FO B cells are additionally shown together with the exon–intron structure of the Hck gene and a scale bar indicated in kilobases. (B and C) Identification of EBF1 peaks and target genes in FO B cells compared with pro–B cells. EBF1 peaks (B) were identified by peak calling using a p-value of <10−10 and were assigned to target genes (C), if they were located from −50 kb upstream of the transcription start site (TSS) to +50 kb downstream of the transcription end site (TES). A second ChIP-seq experiment (Table S2) yielded similar results. (D) Identification of Ell3 and Scd1 as EBF1-activated genes in FO B cells by RNA-sequencing of polyA+ RNA from WT and Cd23-Cre Ebf1fl/− (Ebf1Δ/−) FO B cells (sorting strategy in Fig. S5, A and C). (E) Scatter plot of gene expression differences observed between WT and Ebf1Δ/− FO B cells. The normalized expression values of each gene in the two B cell types were plotted as reads per gene per million mapped sequence reads (RPM). Genes are highlighted in blue or red color, if they were expressed >10 RPMs and regulated at least fourfold between the two cell types. The data of one RNA-sequencing experiment for each cell type was analyzed (Table S2). (F–H) Expression of activated EBF1 target genes (F), as well as indirectly EBF1-activated (G) and EBF1-repressed (H) genes. The expression of each gene in WT (gray bar) and Ebf1Δ/− (black bar) FO B cells is shown as normalized expression value, which was determined as reads per kilobase of exon per million mapped sequence reads (RPKM). Different colors indicated genes of distinct functional categories.

