Figure 8.
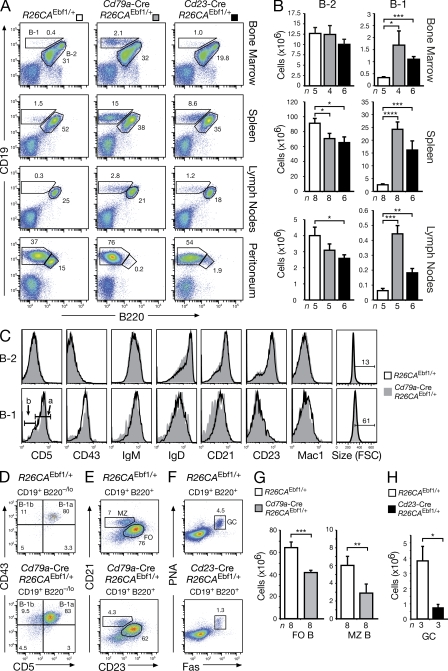
Increased B-1 and reduced B-2 cell differentiation upon ectopic EBF1 expression. (A and B) B-1 (CD19+B220lo/–) and B-2 (CD19+B220+) cells were analyzed by flow cytometry in the bone marrow, spleen, lymph nodes, and peritoneum of R26CAEbf1/+ (white bars), Cd79a-Cre R26CAEbf1/+ (gray bars), and Cd23-Cre R26CAEbf1/+ (black bar) mice (A). Absolute cell numbers were determined for B-1 and B-2 cells in the bone marrow, spleen, and lymph nodes (B). n, number of mice analyzed. (C) Cell surface phenotype of B-1 and B-2 cells from the spleen of R26CAEbf1/+ mice (black line) and Cd79a-Cre R26CAEbf1/+ (gray) littermates. The B-1a (CD5+) and B-1b (CD5–) B cells are indicated. (D) Flow cytometric identification of B-1a cells (CD5+CD43+CD19+B220lo/–) and B-1b cells (CD5–CD43+CD19+B220lo/–) in the spleen of Cd79a-Cre R26CAEbf1/+ and control R26CAEbf1/+ littermates. The relative percentage of each B1 cell type is shown in the respective quadrant. (E–H) The relative percentages and absolute numbers of MZ and FO B cells (E and G), as well as GC B cells (F and H) were determined by flow cytometric analysis of the spleen from mice of the indicated genotypes. GC B cells were analyzed 7 d after immunization with SRBCs. Statistical data (B, G, and H) are shown with SEM and were analyzed by Student’s t test. *, P < 0.05; **, P < 0.01; ***, P < 0.001; and ****, P < 0.0001.

