Figure 9.
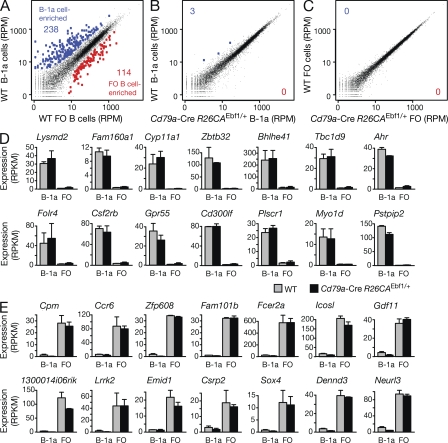
RNA-sequencing identified the EBF1-induced B-1a cells as bona fide B-1a cells. (A–C) Scatter plots of gene expression differences between WT and EBF1-overexpressing B-1a and FO B cells. Two independent RNA-sequencing experiments (Table S2) were performed for each FACS-sorted B-1a or FO B cell type isolated from the spleen of WT or Cd79a-Cre R26CAEbf1/+ mice (sorting strategy in Fig. S5, A and B). The average of the normalized expression values (RPM) for each gene were plotted to indicate the gene expression differences between the different cell types. Genes are highlighted in blue or red if they were called as differentially expressed genes with an adjusted p-value of <0.1. (D and E) Expression of B-1a cell–enriched (D) and FO B cell–enriched (E) transcripts, which were identified by comparison of WT B-1a and FO B cells (A). The expression of the indicated genes in B-1a and FO B cells of WT (gray bars) and Cd79a-Cre R26CAEbf1/+ (black bars) mice is shown as average of the normalized expression value (RPKM) together with the SEM.

