Figure 1.
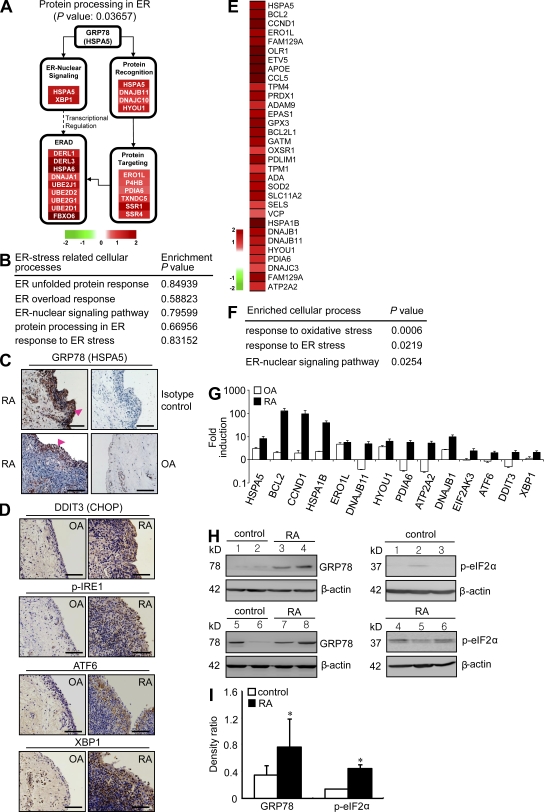
ER stress response is increased in RA synovia and synovial cells. (A) Illustration of protein processing in the ER pathway with up-regulated genes in RA synovial tissue. Node colors represent fold change in RA synovial tissues as compared with normal synovial tissues (red, up-regulated; and green, down-regulated). (B) Functional enrichment analysis of up-regulated genes in OA tissues compared with normal. (C and D) Representative immunohistochemical stainings for ER stress–associated molecules in synovium sections obtained from RA and OA patients. (C) Tissues stained with anti-GRP78 antibody are representative of three RA and three OA patients. Intense staining in the synovium was observed in the lining layer (arrowheads). (D) Immunohistochemical staining of RA and OA synovia using anti-DDIT3 (CHOP), anti–p-IRE1, anti-ATF6, and anti-XBP1 antibody. Bars, 120 µm. (E) Heat map displaying 32 ER stress–associated up-regulated genes in RA macrophages. (F) Cellular processes enriched by DEGs in RA macrophages. Functional enrichment analysis of up-regulated DEGs was performed using DAVID software. (G) Quantitative real-time PCR assays of a subset of DEGs up-regulated in RA macrophages (n = 5) and proximal UPR genes. Four independent macrophage samples of healthy subjects and nine OA macrophages isolated from OA synovial tissues were used as controls. Fold inductions were calculated using the 2−ΔΔCt method. (H) Basal expression levels of ER stress–associated molecules in macrophages of healthy controls and RA patients, as determined by Western blot analysis using anti-GRP78 (left) and p-eIF2α (right) antibody. (I) Comparison of the optical density ratio ([GRP78 or p-eIF2α]/β-actin) between RA macrophages and normal (control) macrophages. *, P < 0.05 versus normal macrophages. (G and I) Data show mean ± SD.

