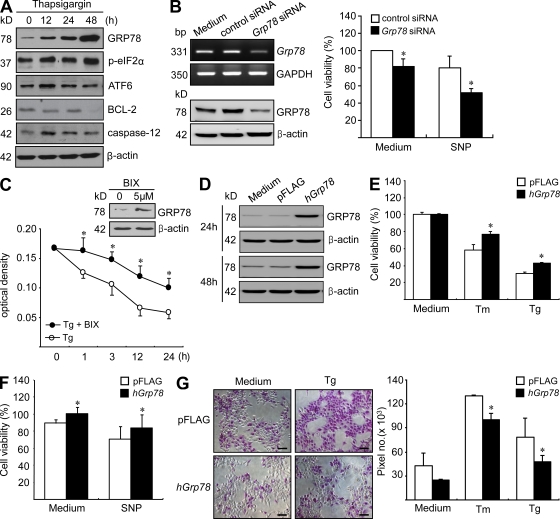
Figure 3.
Role of GRP78 in synoviocyte survival. (A) Changes in ER sensor proteins in RA synoviocytes treated with 10 µM thapsigargin. The expressions of GRP78, p-eIF2α, ATF-6, BCL-2, and caspase-12 were determined by Western blot analysis. (B) The effect of Grp78 knockdown on synoviocyte survival. 2 d after transfection with siRNA for Grp78, the mRNA and protein expression levels of GRP78 in RA FLSs were determined by RT-PCR and Western blot analysis, respectively (left). The apoptosis of RA FLSs was induced by treating cells with 1 mM SNP for 12 h 2 d after Grp78 siRNA transfection. Degree of cell death was assessed by MTT assay (right). Results are the mean ± SD of more than four independent experiments performed in duplicate. *, P < 0.05 versus control siRNA–transfected cells. (C) RA FLSs were treated with BIX for 12 h, and then GRP78 expression was determined by Western blot analysis. Synoviocyte apoptosis was induced by treating RA FLSs with 10 µM thapsigargin in the presence or absence of BIX. *, P < 0.05 versus thapsigargin-treated cells in the absence of BIX. (D) SV40-immortalized RA FLSs were transfected with either the pFLAG-hGrp78 gene or pFLAG vector only. The protein expression levels for GRP78 were determined by Western blotting. (E and F) RA FLSs transfected with either the pFLAG-hGrp78 gene or pFLAG vector were treated with 5 µM thapsigargin (Tg) for 1 h, 10 µg/ml tunicamycin (Tm) for 12 h, or 5 mM SNP for 24 h. Cell viability was determined by MTT assay. *, P < 0.05 versus vector-transfected cells. (G) The apoptosis of RA FLSs harboring the pFLAG-hGrp78 gene or pFLAG vector was induced by treating cells with 5 µM thapsigargin or 10 µg/ml tunicamycin for 3 h. Degrees of apoptosis were assessed by APOPercentage apoptosis assay, a colorimetric method. Apoptotic cells appeared bright pink. Fold increase in apoptosis levels was expressed as pixel numbers. *, P < 0.05 versus vector-transfected cells. Bars, 100 µm. (C and E–G) Data show mean ± SD.

